INTERNAL WEB APP | 2020 - 2021
Operational Maps is a feature within Aurizon’s new ‘Vista’ train management platform. It replaces Loco Tracker, the legacy software which LRC Deployment staff previously used to monitor the movements of train services and cars. The design challenge required merging the Aurzion rail network with open-source GIS data, while effectively visualising the real-time positional data of moving assets.
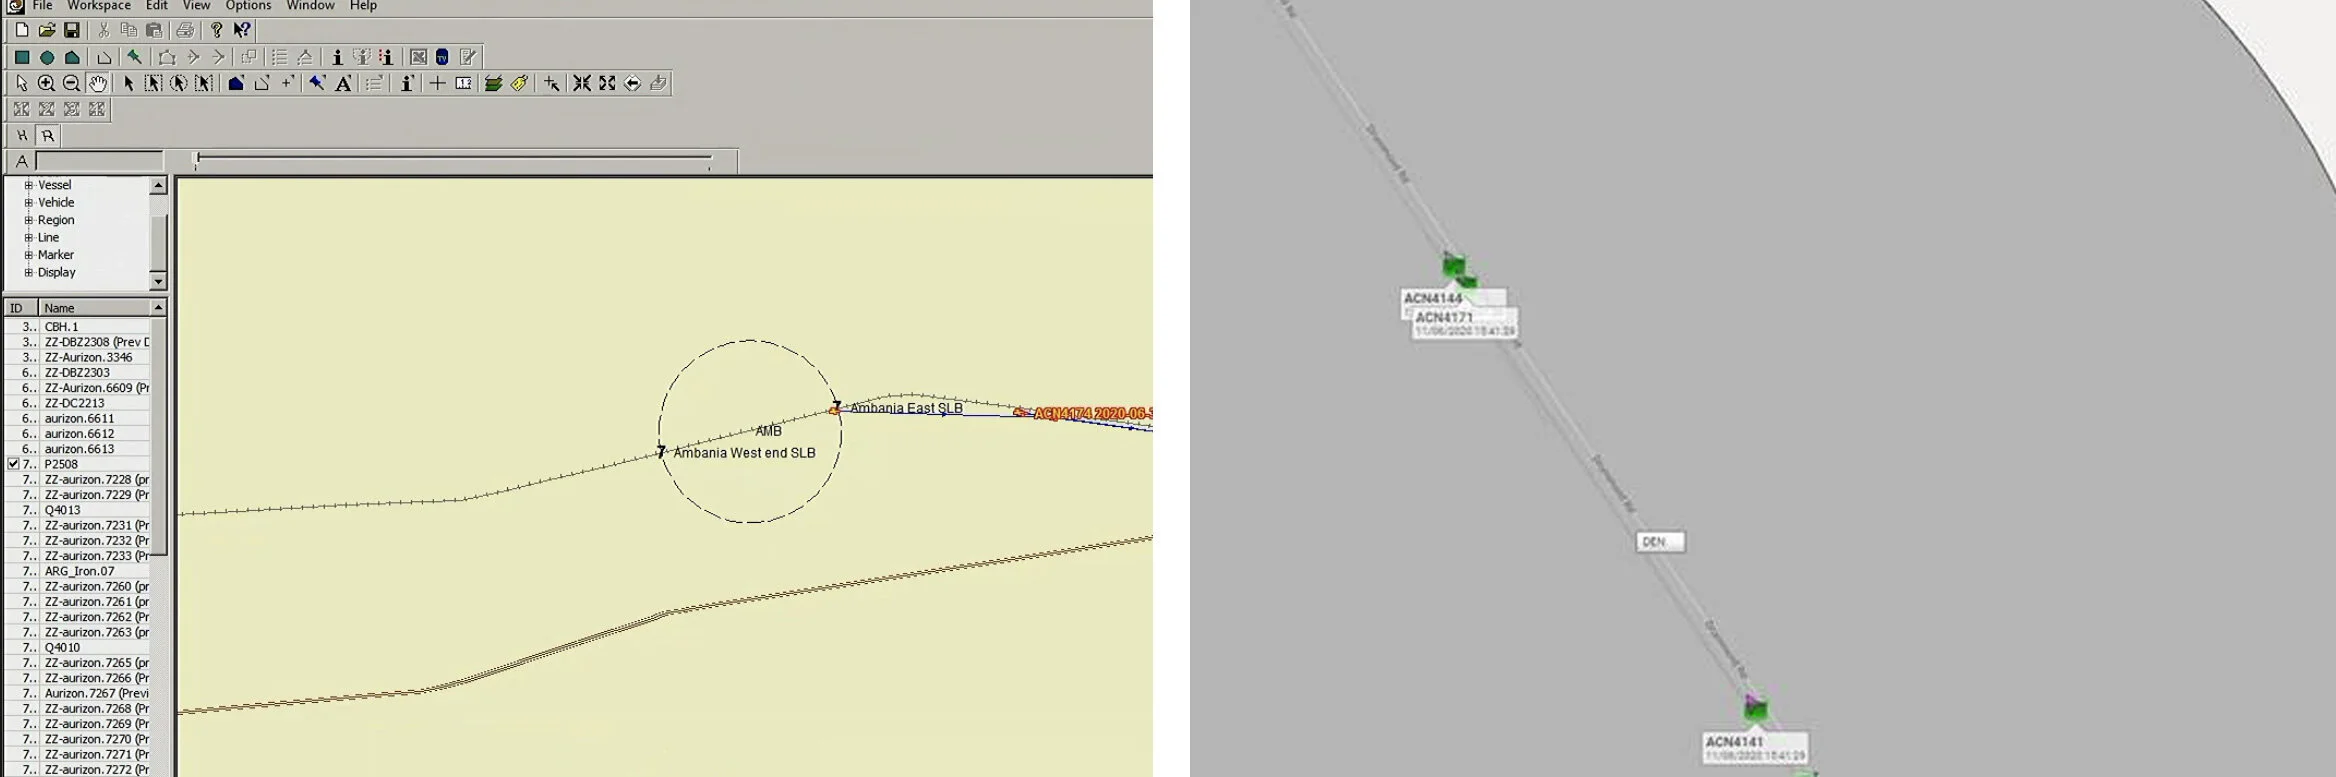
During the initial discovery phase, I led focus-groups and one-on-one interviews with LRC (Live Run Coordinator) users, where I identified several pain-points with their current experience. The key frustration being that to monitor and track the geographic location of Aurizon assets, two different platforms were used. This required LRCs to switch back and forth between disparate map experiences to track and align movements between train services and crew changes, (cars rendezvousing with trains at remote locations across Australia).
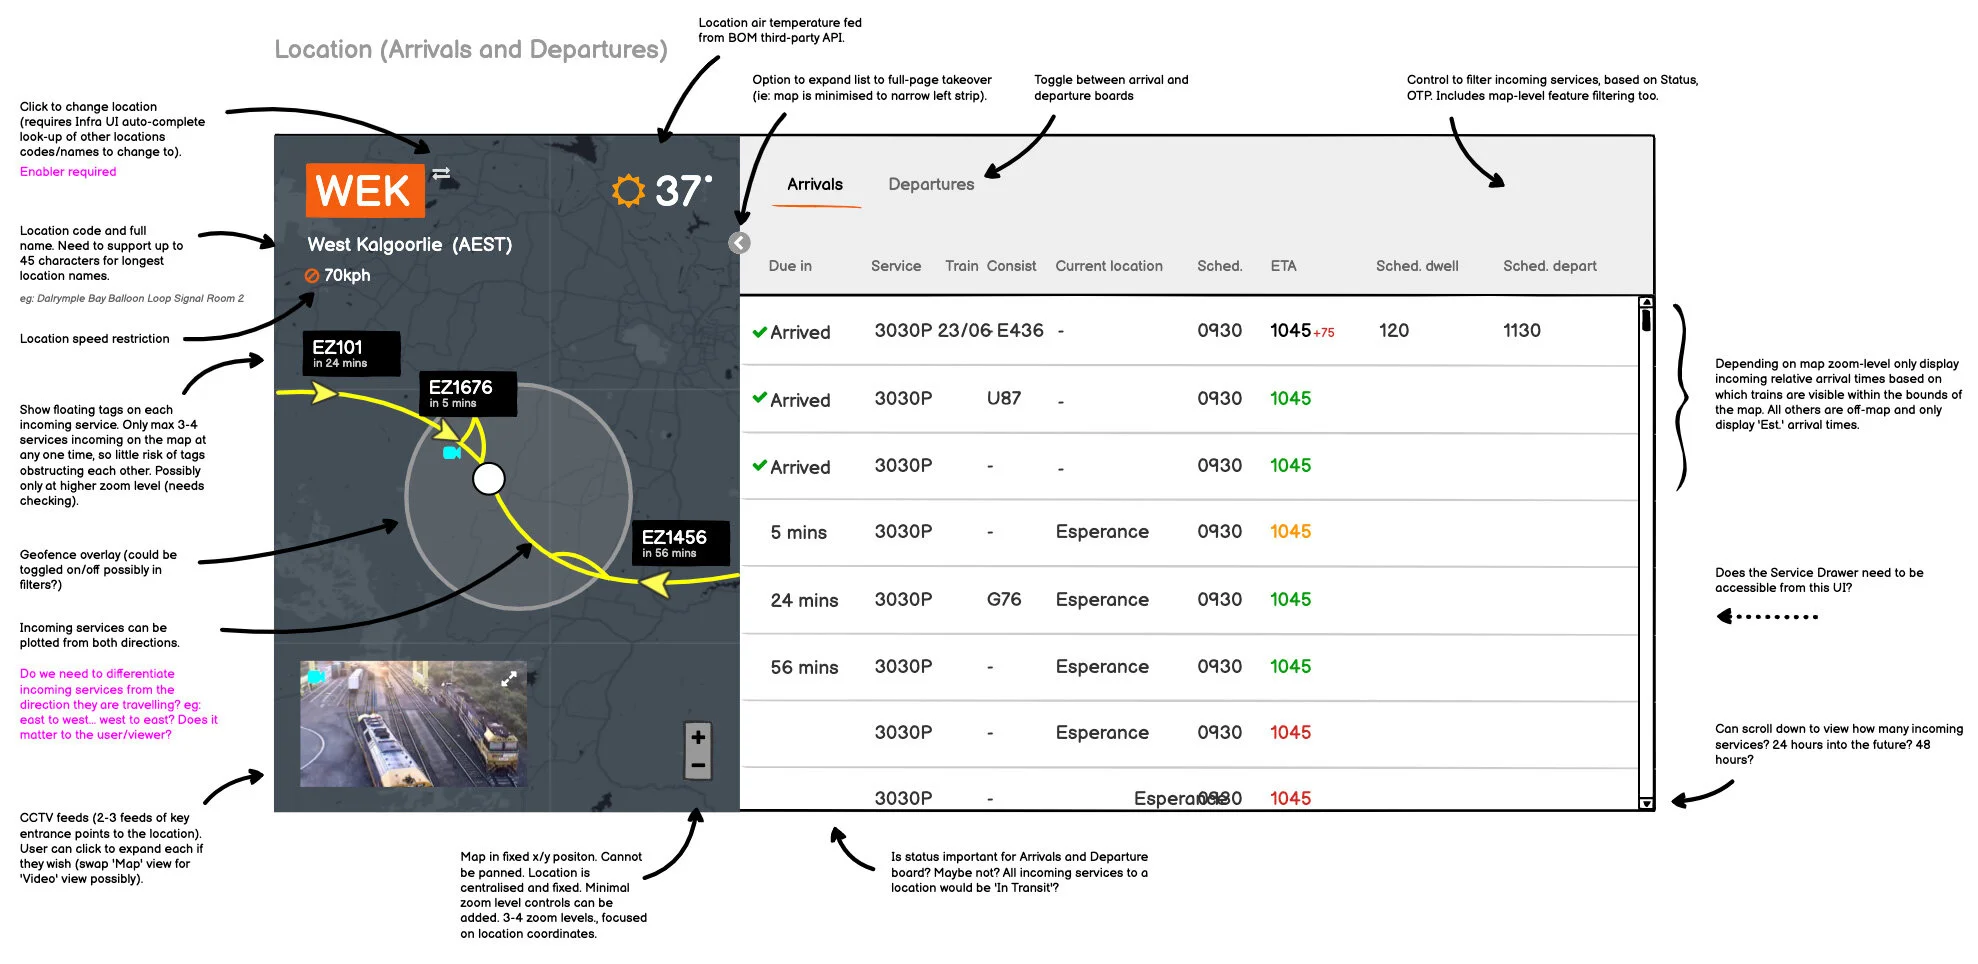
I created a series of wireframes to explore how user pain-points could be alleviated by a single integrated view, which visualised real-time GPS tracking of trains and cars. This included geo-fences, live weather overlays, CCTV feeds and track temperatures.
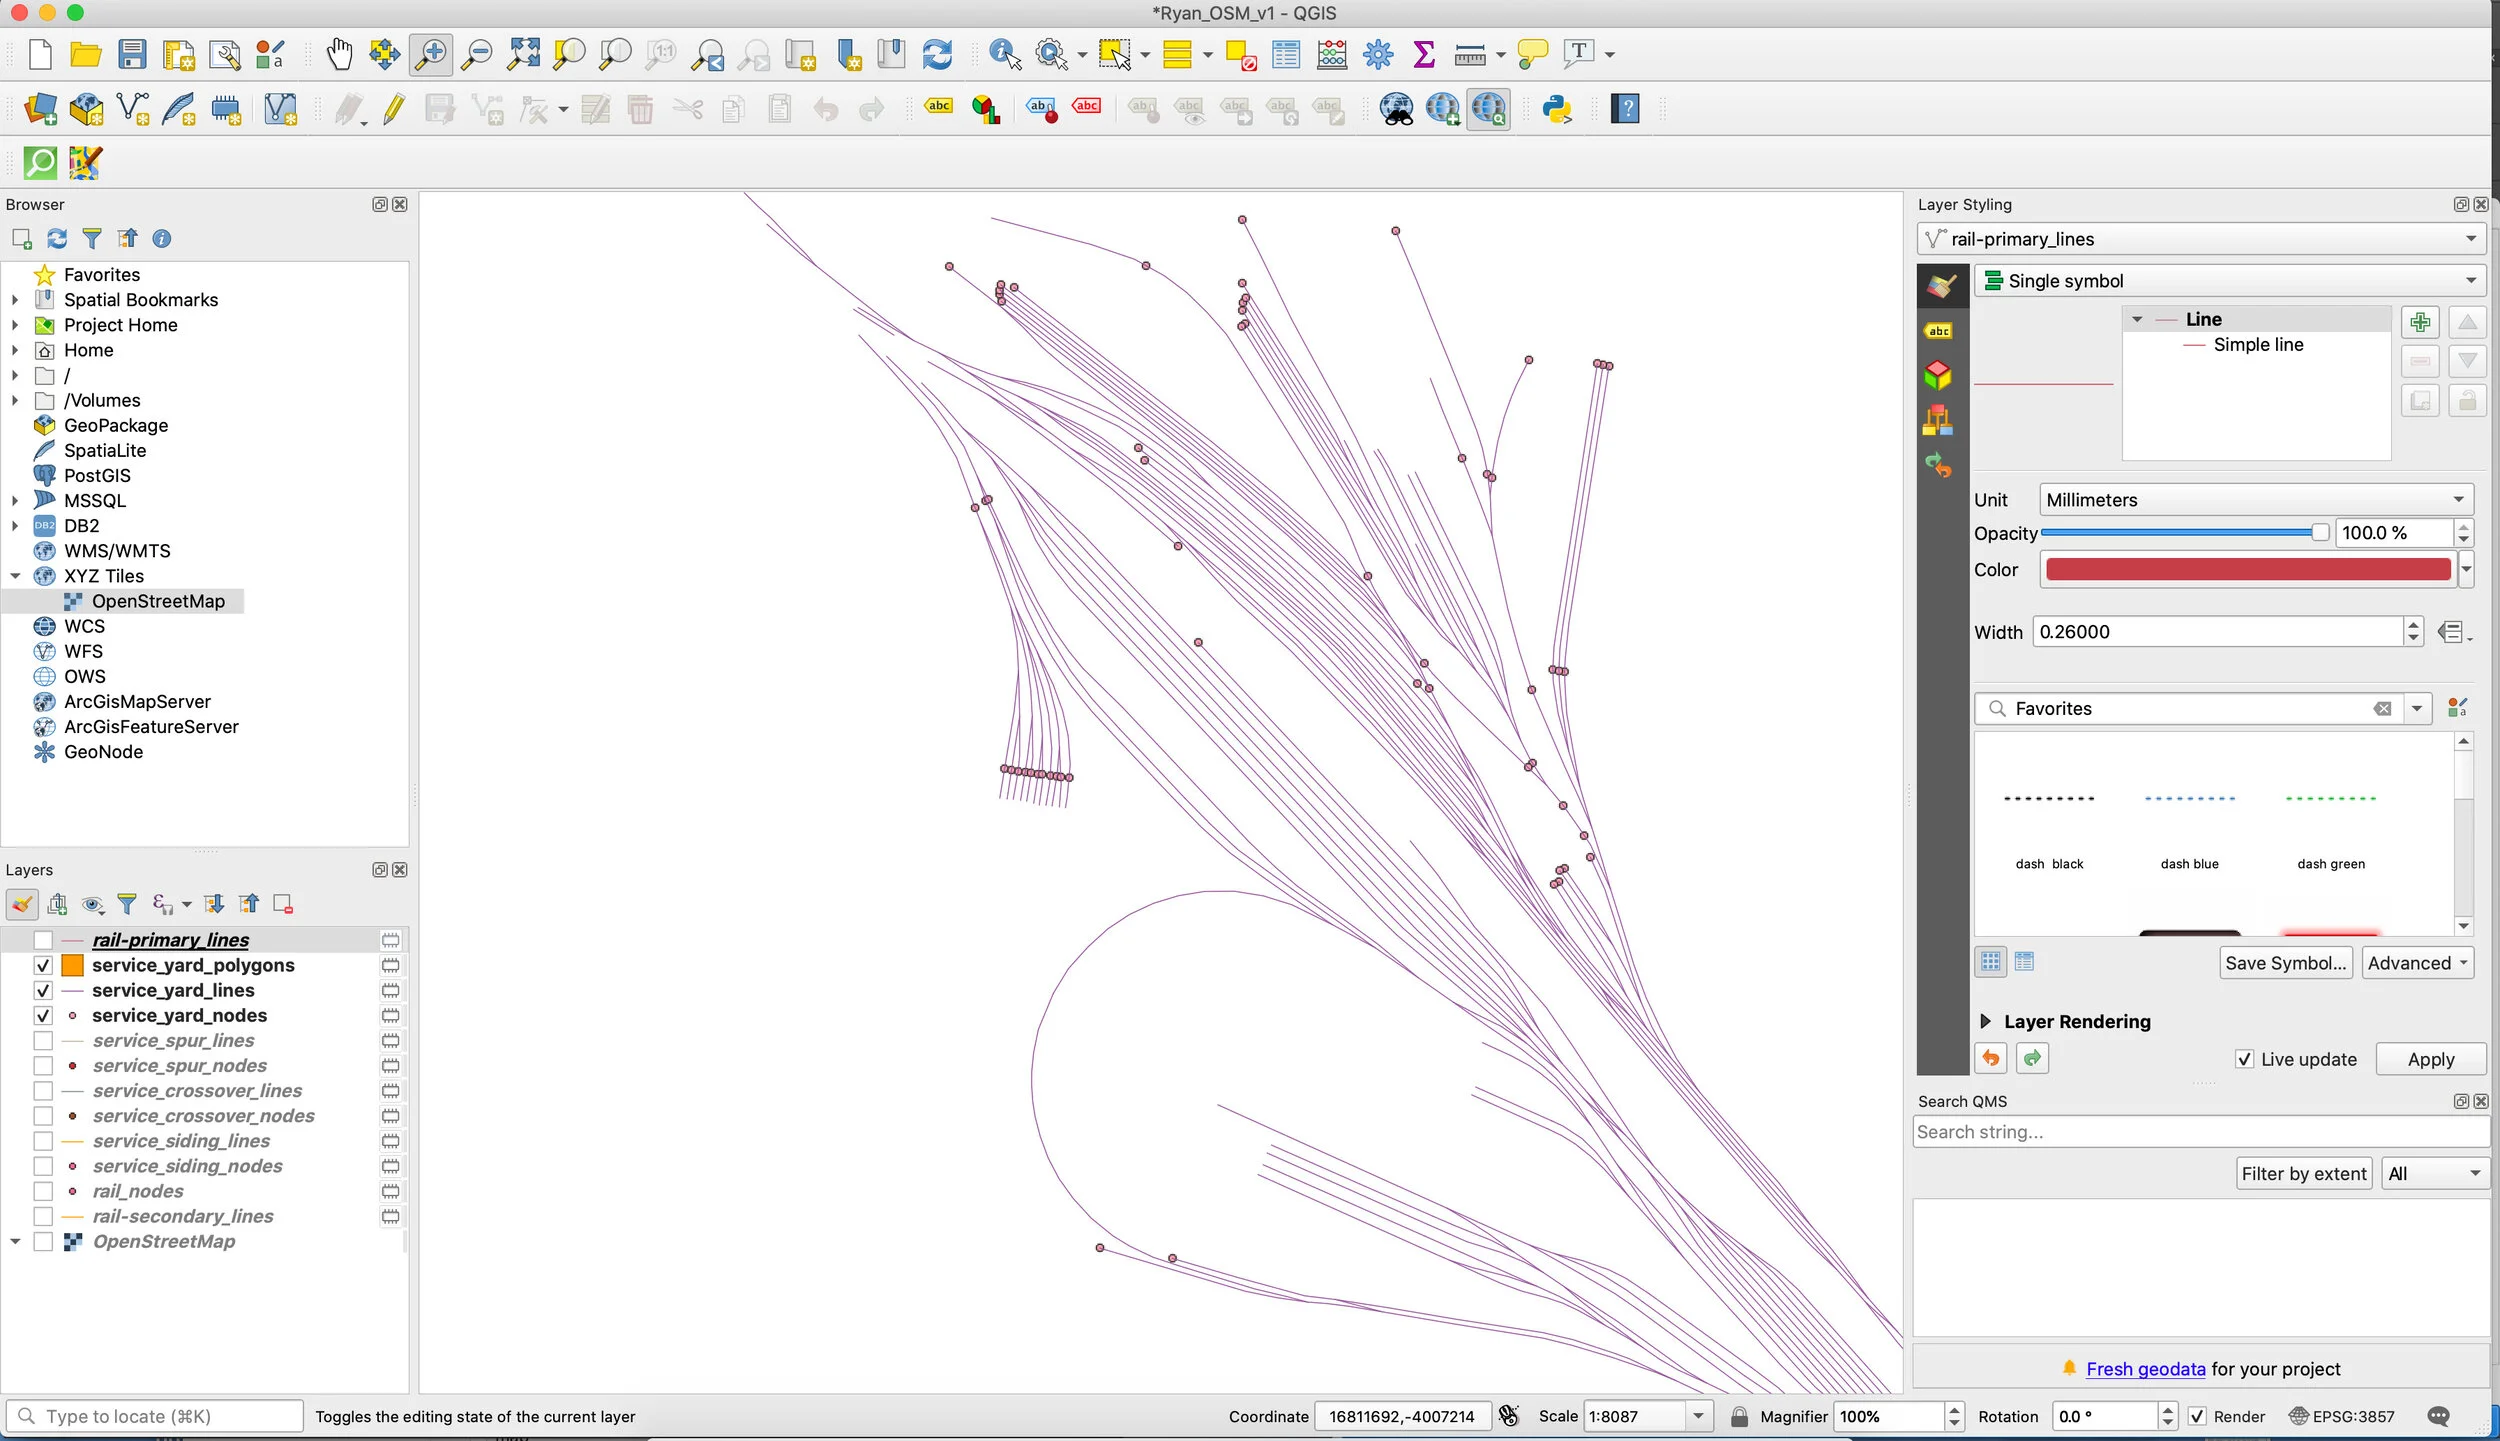
My development team had minimal GIS (Geographic Information System) knowledge. So I took it upon myself to research and understand the key disciplines associated with spatial data science, such as; reference frameworks, data models and geo-visualisation.
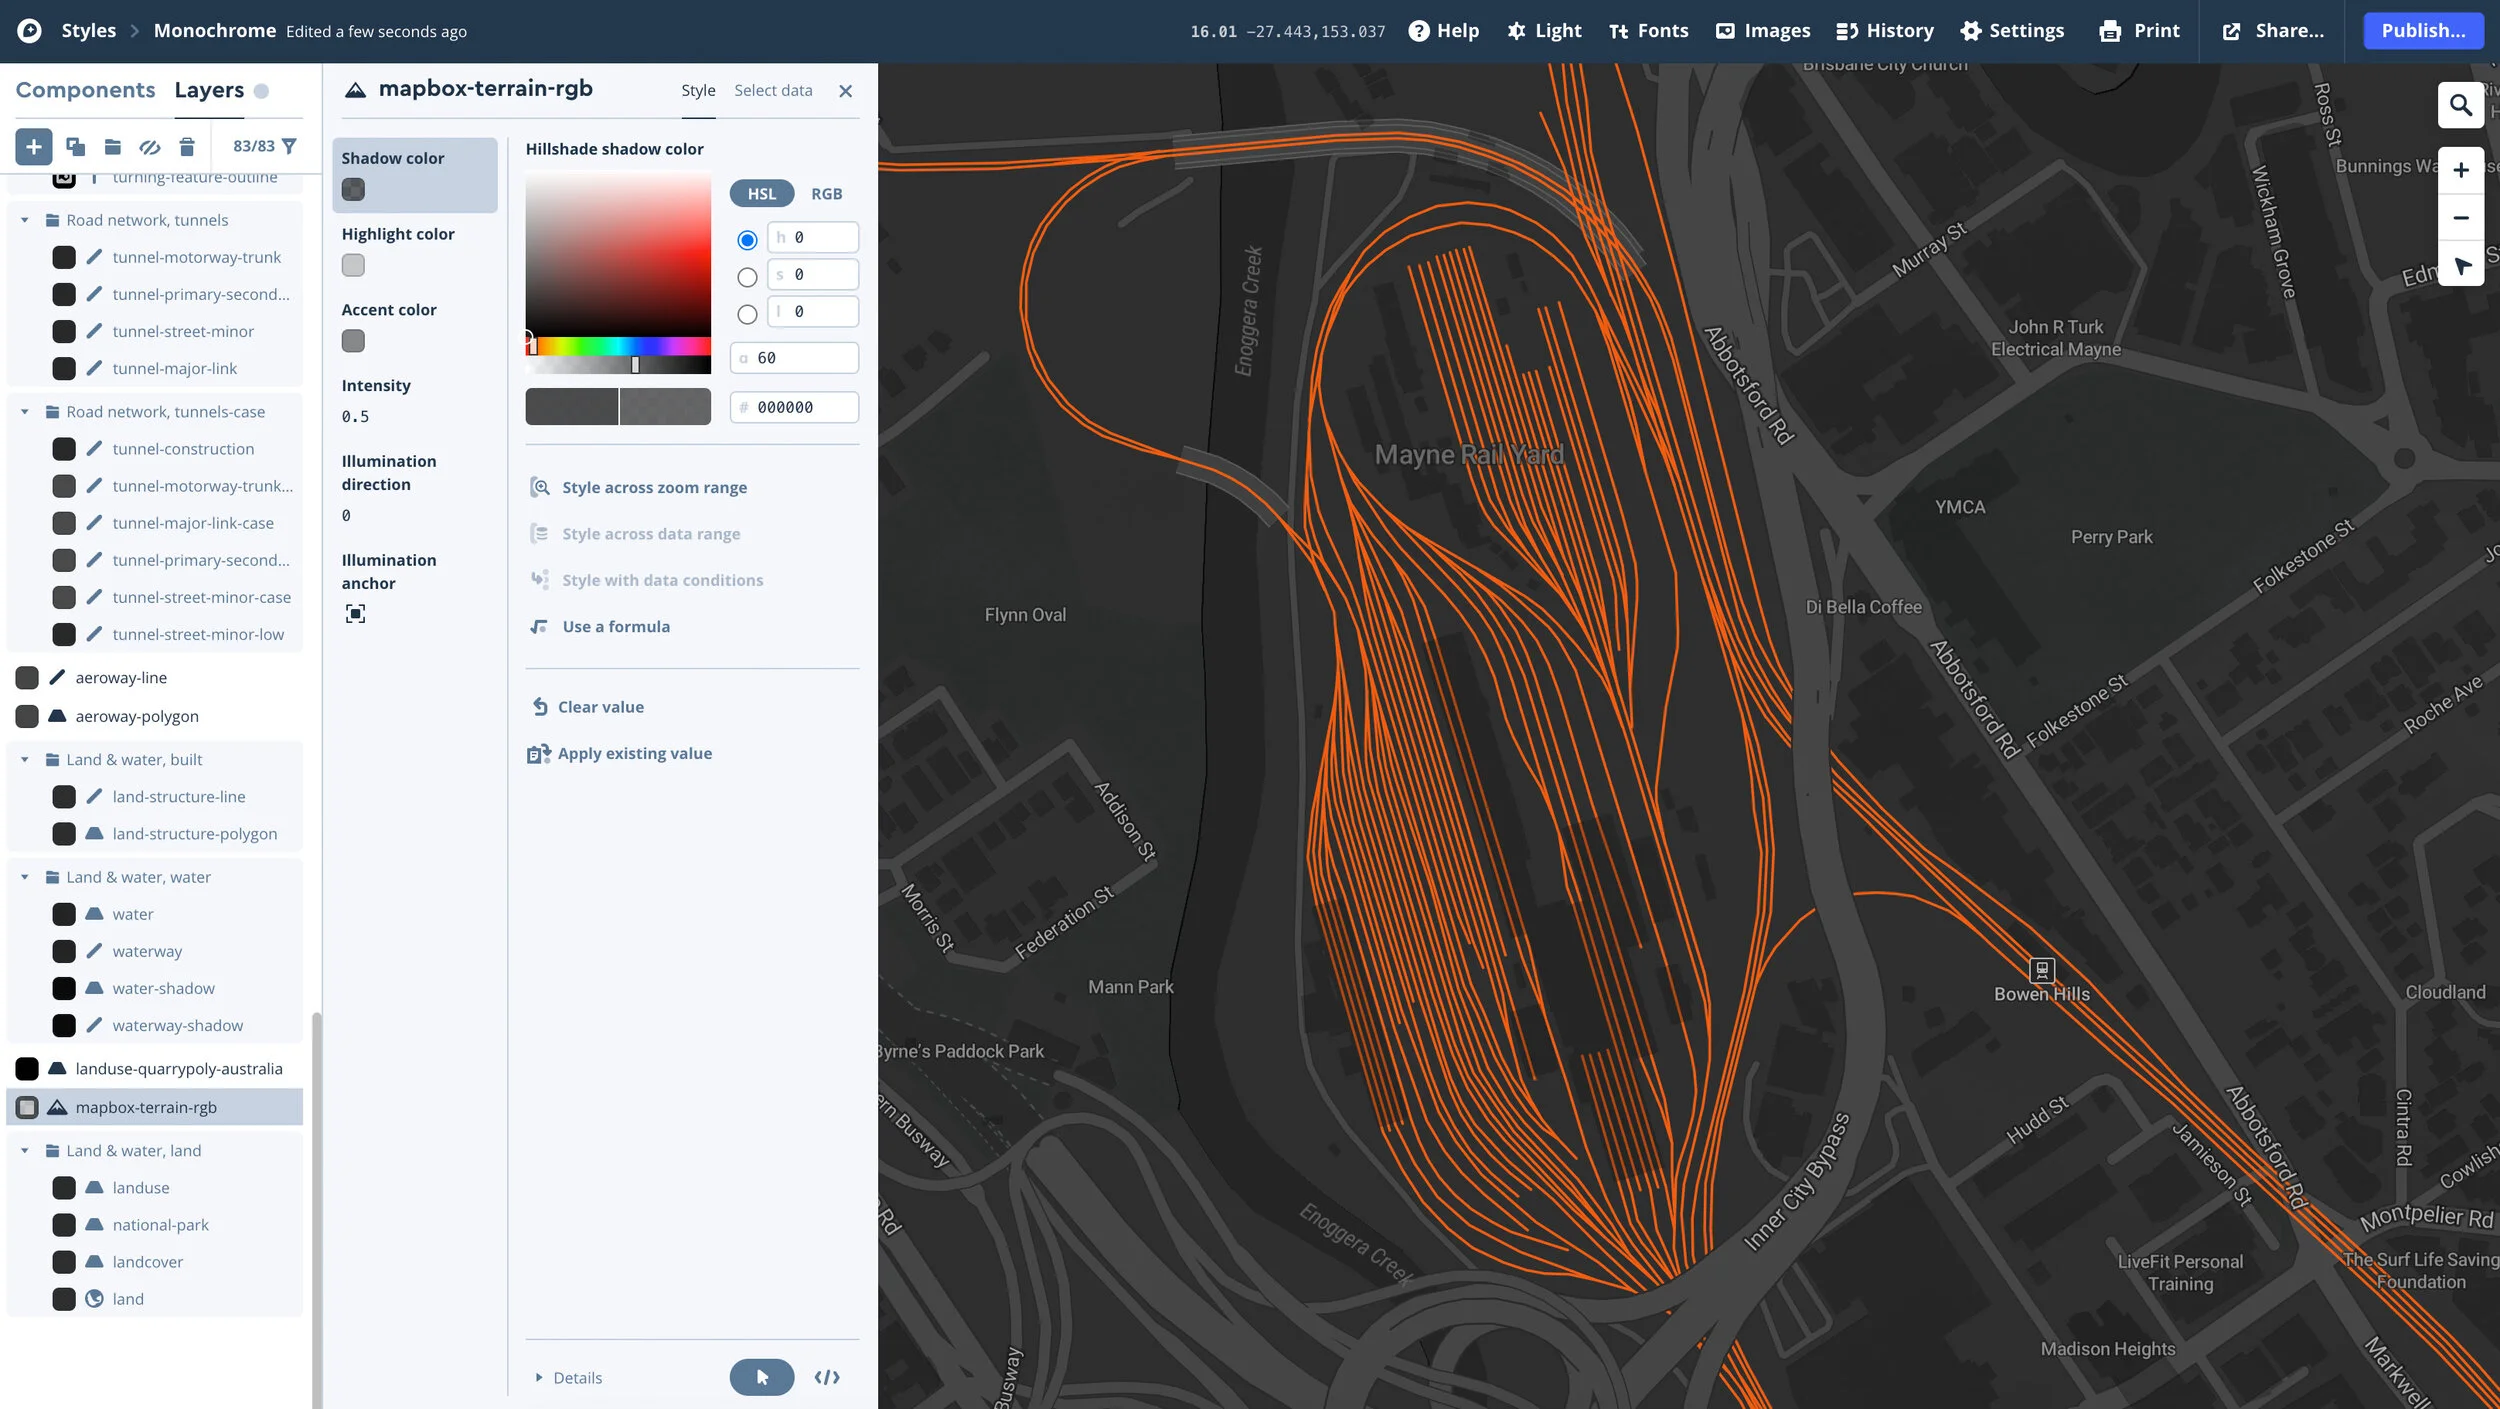
The business required the merging of Aurizon track and location data with open-source real-world data, such as topography, administrative boundaries and streets etc. We determined that MapBox offered the best solution. Utilising OpenStreetMaps (OSM) with QGIS, I imported specific railway-related features into MapBox, which could then be styled and layered accordingly.
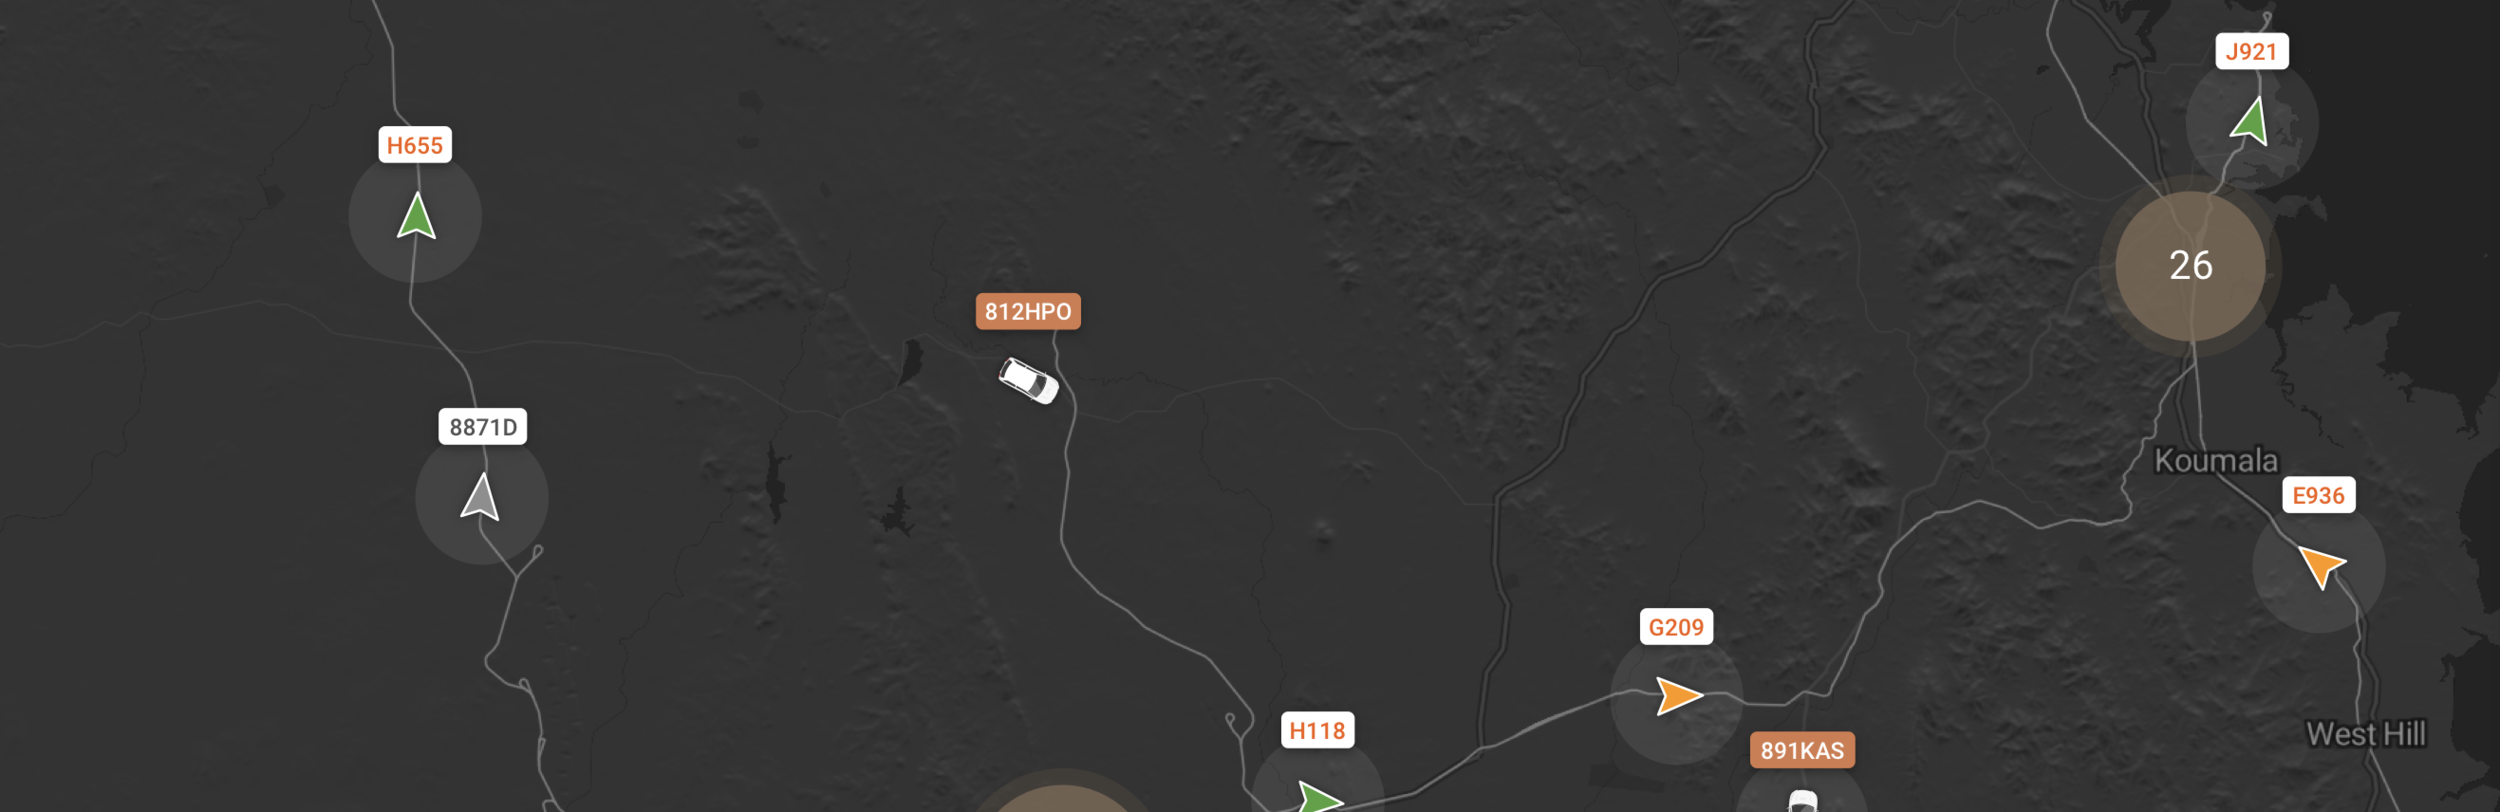
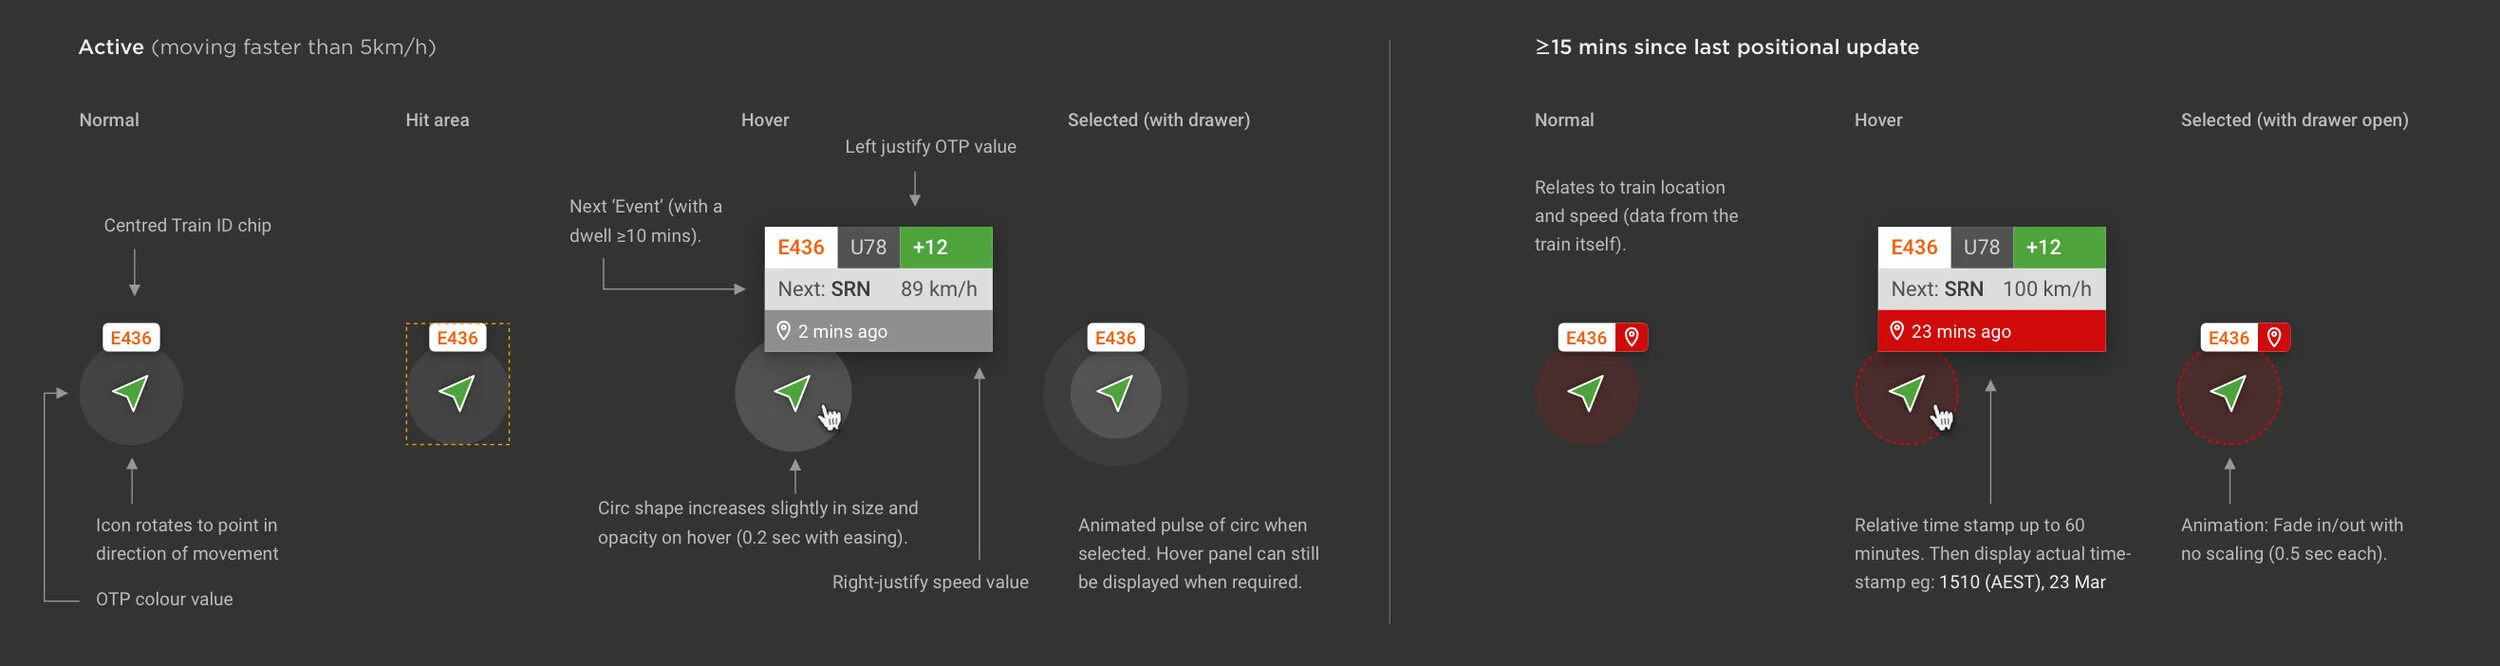
Train and Car assets were represented using simplistic icons. These displayed key ID numbers, along with directional cues to the user. Hover states provided secondary information such as; speed, on-time performance and next location.
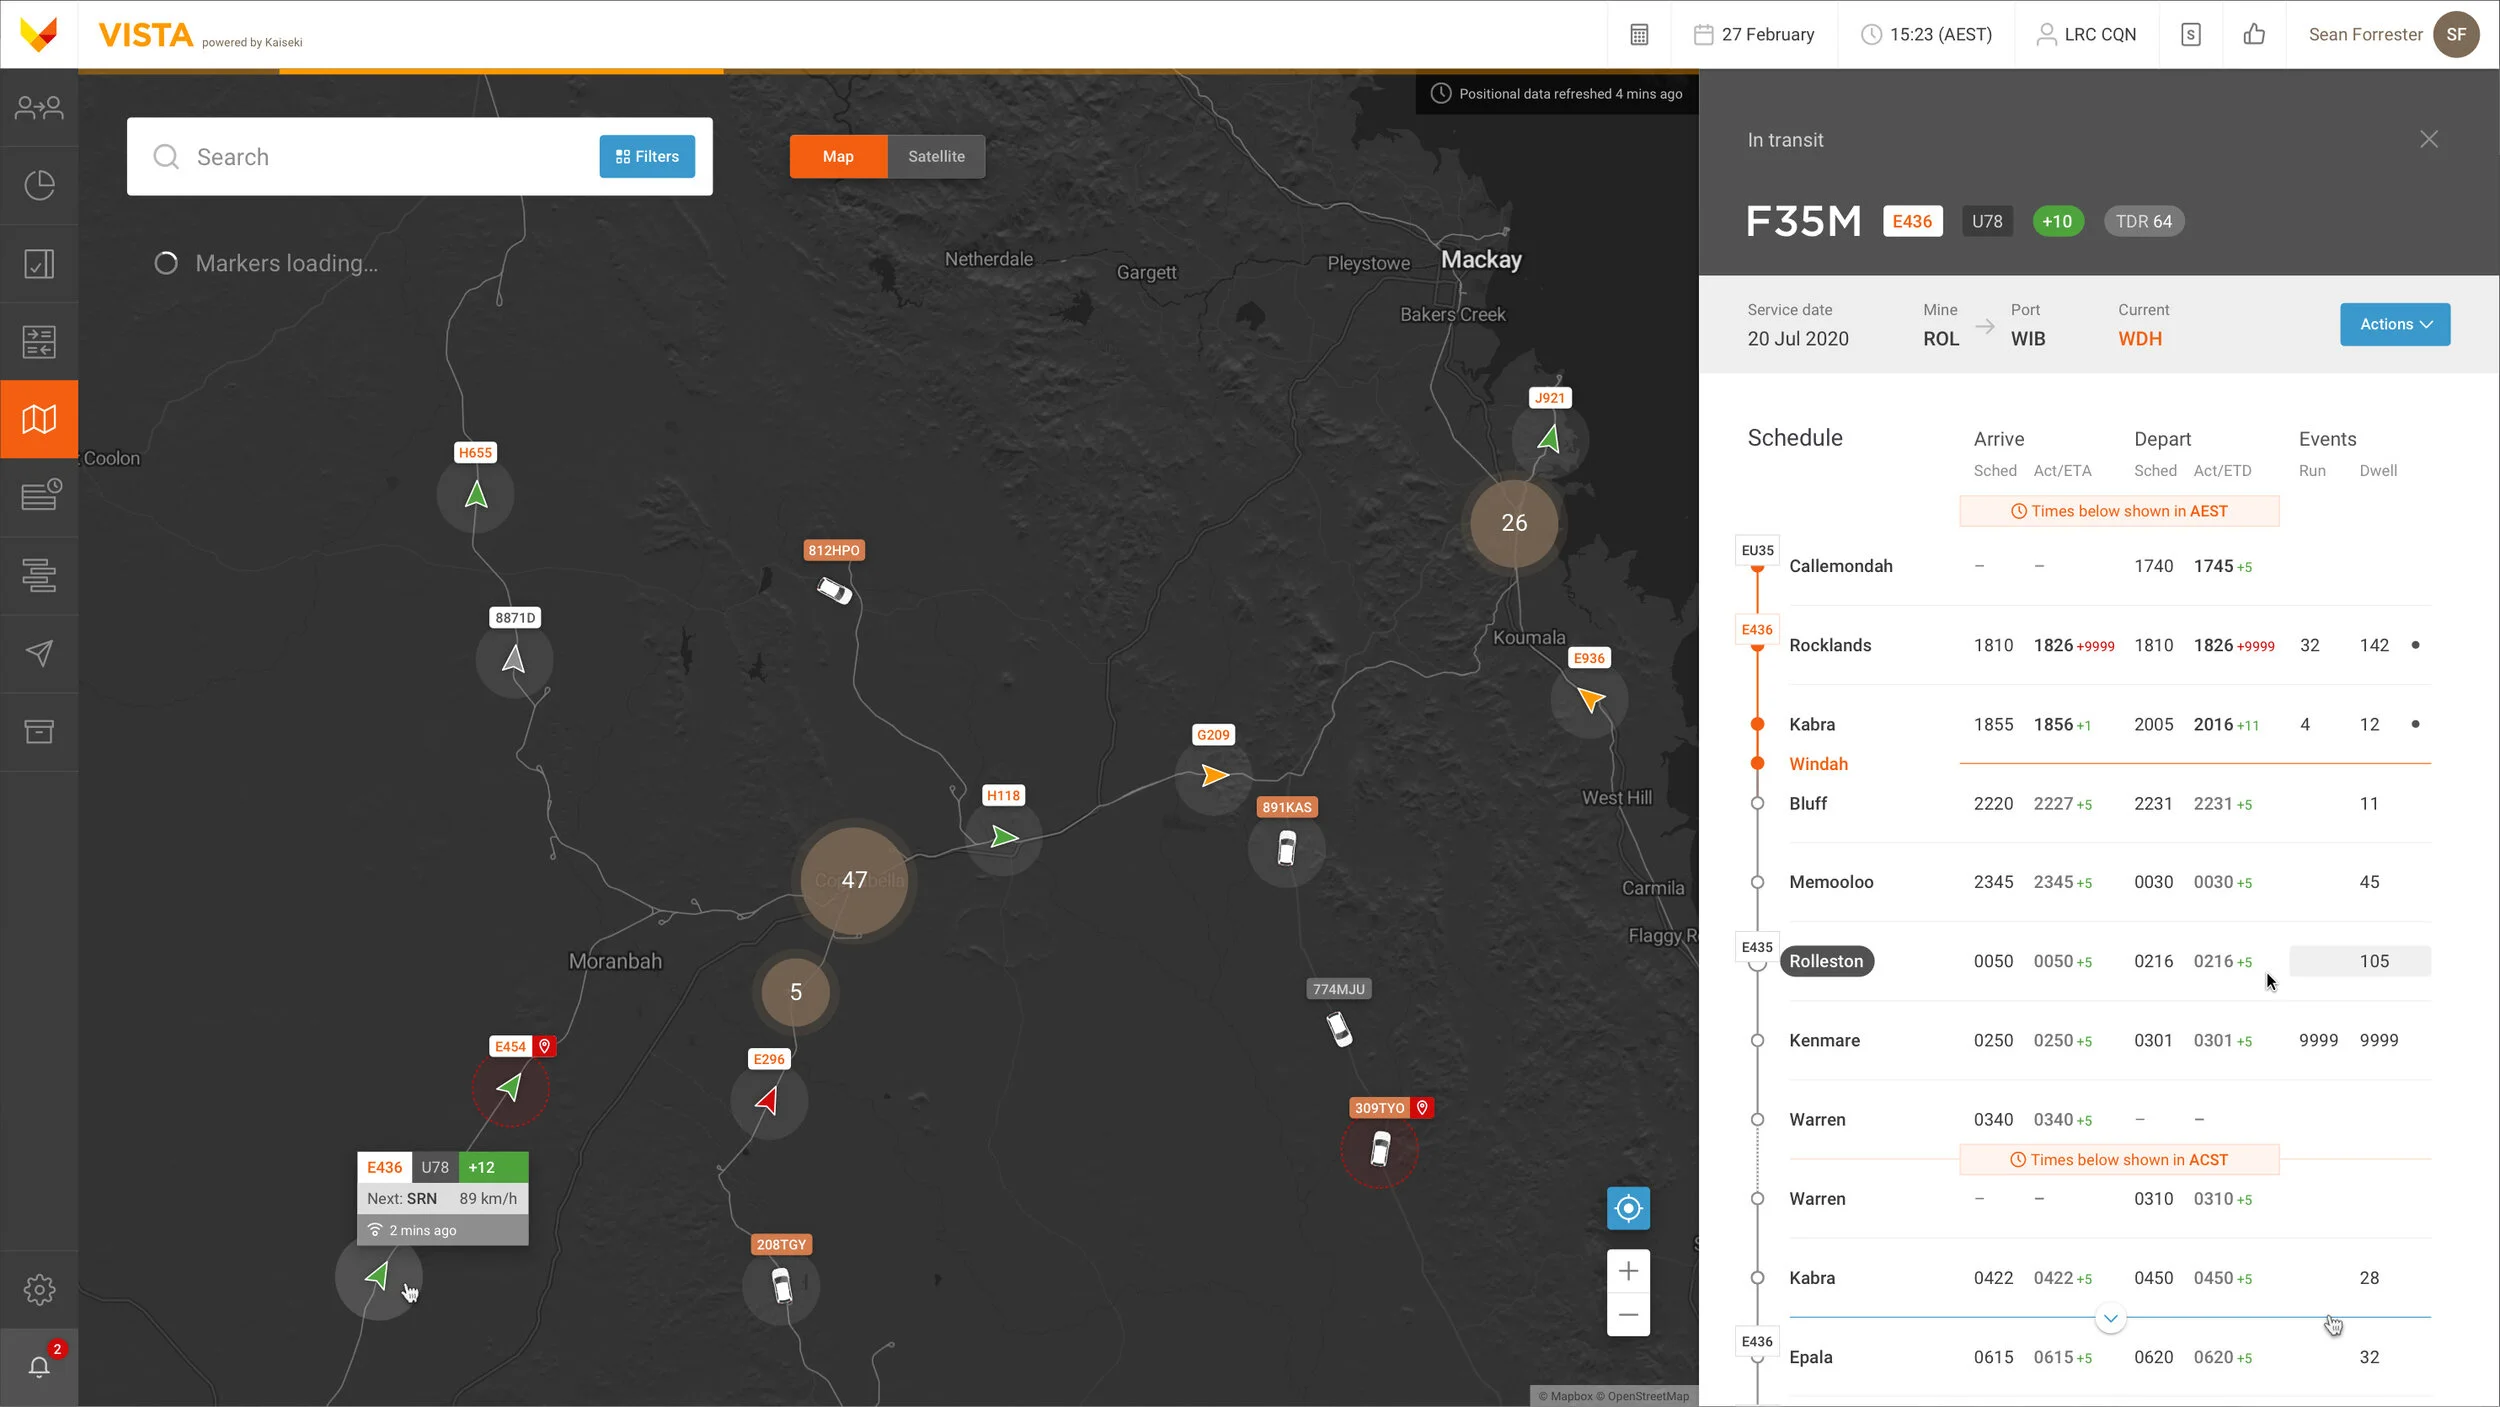
The final design layered real-time GPS positioning of both Train and Car assets into a simple and easy to use interface.
A key design consideration was ensuring geographical data, rail lines and locations, were visible but carefully weighted. To ensure the layered positional data of over 400 asset markers would have visual prominence.
Light and Dark modes were developed to support night-shift users.
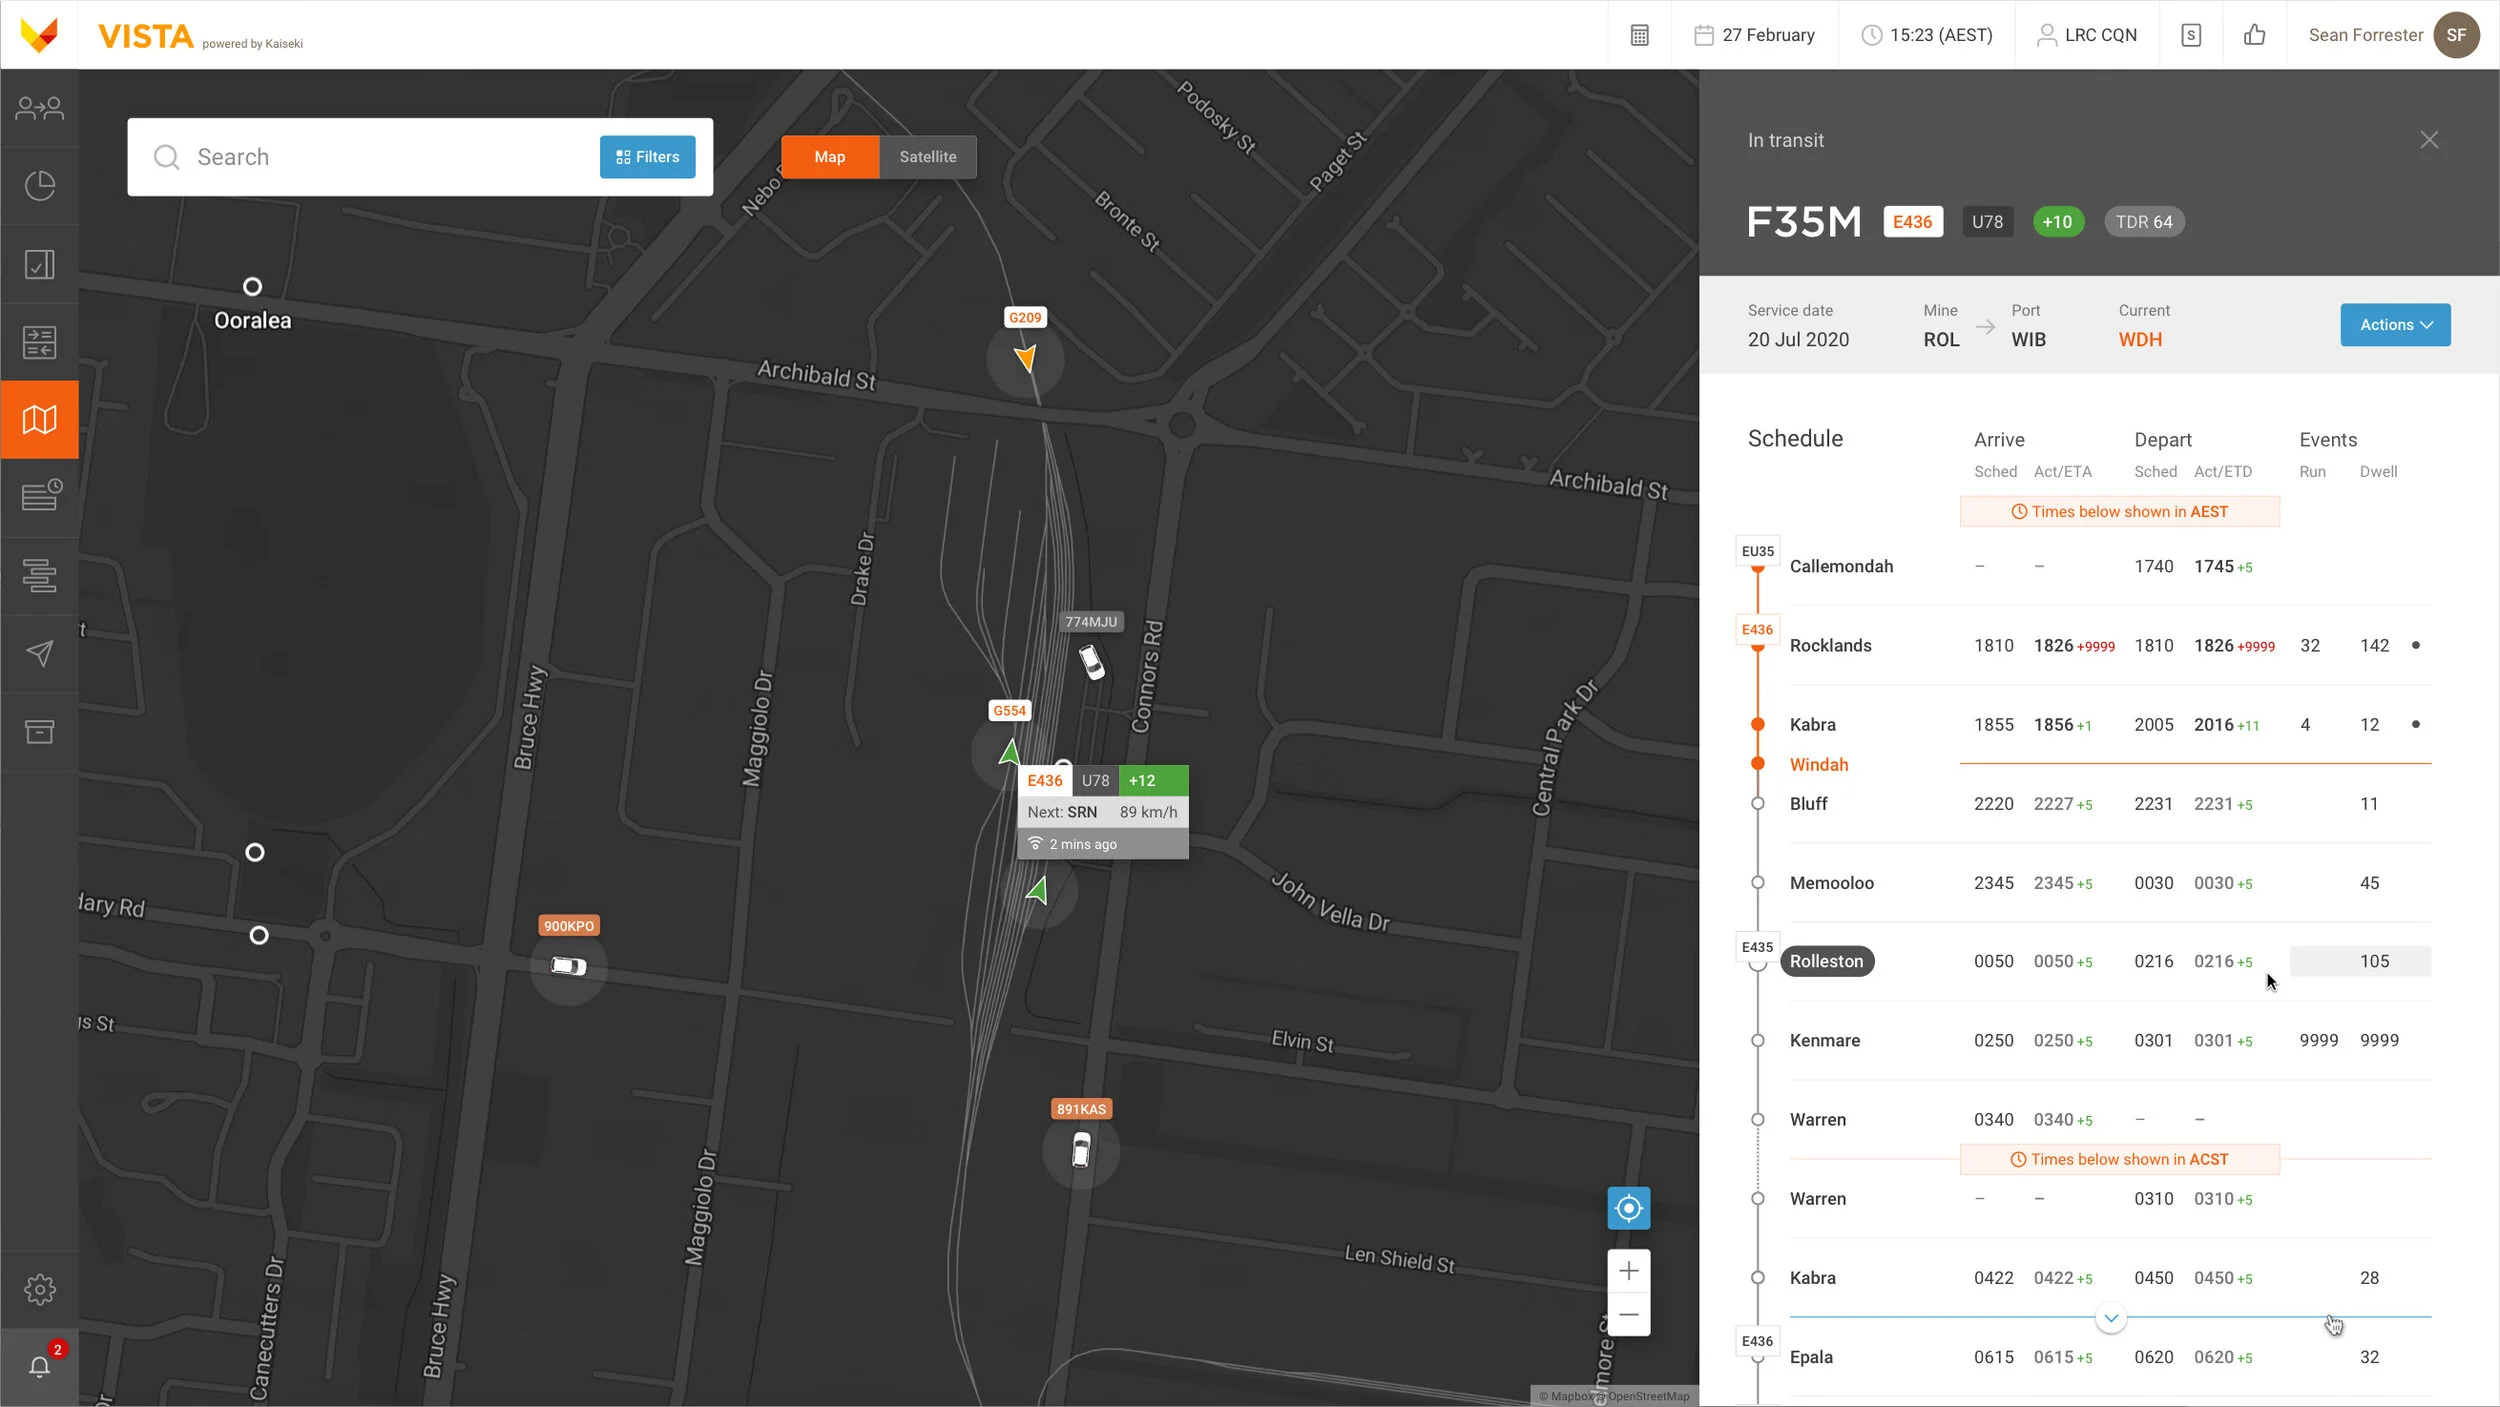
Now for the first time, users can align both Train and Car movements in a single geographical view, to more accurately determine intersecting points on a service route where crew changes can take place safely and on-schedule. The experience was further supported by live weather alerts, track temperature warnings and live satellite imagery during priority events (eg: accidents).
The user experience has been well-received by LRC users. Helping to streamline their workload, improve visualisation of key assets and reduce delays caused by late crew changes.